SYSTEMS · BIOSECURITY · 2025
Biosurveillance “Digital Immune System”
An interactive early-warning dashboard that fuses wastewater viral load, hospital admissions, and environmental signals into a single interpretable risk index.
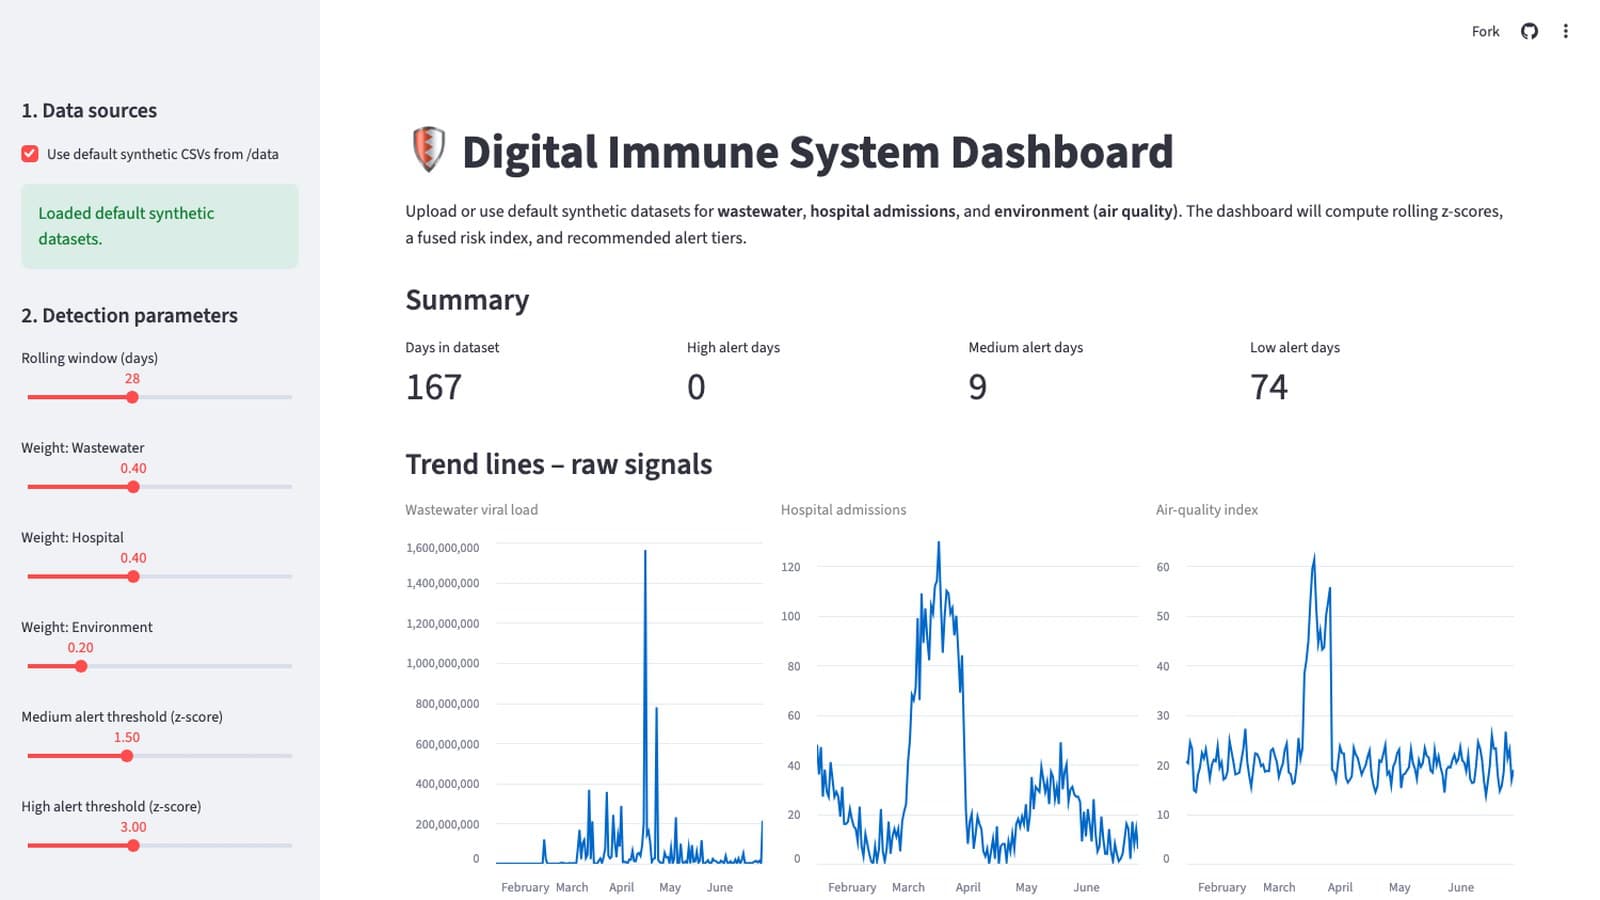
Built in Python and Streamlit, the prototype lets users upload data or explore synthetic scenarios, adjust rolling baselines and signal weights, and inspect how multiple anomalies combine into tiered alerts.
- Role
- Founder & Project Lead
- Organization
- Gordian Knot Center
- Stage
- Functional Prototype
- Signals
- 3
- Stack
- Python + Streamlit
Independent signal streams
Example rolling baseline windowConfigurable default
Synthetic scenario modes
Operational alert states
The current prototype operates on uploaded or packaged synthetic datasets.
Overview
Biological threats rarely appear as one obvious signal
Designed and implemented an interactive biosurveillance prototype that combines wastewater viral load, hospital admissions, and environmental signals into a unified early-warning risk index.
The system treats each signal as one imperfect sensor. Rolling baselines standardize the streams, configurable weights fuse their evidence, and tiered alerts reveal when multiple weak anomalies begin to align.
The prototype demonstrates the core sensing loop; the accompanying brief explores how that loop could evolve into a distributed, governed national biosecurity network.
Wastewater
Can show changes in population-level pathogen shedding before severe clinical outcomes become visible.
Prototype signal
Viral-load time series
Hospital admissions
Reflects downstream healthcare burden and severity.
Prototype signal
Respiratory or outbreak-related admission counts
Environmental conditions
May reveal air-quality anomalies, hazardous exposure, or context that changes how other signals are interpreted.
Prototype signal
AQI or PM2.5-style measurements
Each stream is noisy and incomplete. The system looks for synchronized deviations across multiple independent sources.
Signals
How three weak signals become one interpretable warning
An educational simulation with synthetic, illustrative data — local to this page and disconnected from the live Streamlit application.
Wastewater
Hospital admissions
Environment
Fused risk
Baseline — -1.16Signal contribution to current risk
With a 28-day rolling window and weights of 45 wastewater, 35 hospital, and 20 environment, the current fused risk is -1.16, which falls in the Baseline tier.
Fusion
Standardize first, then combine
z(t) = [x(t) − μroll(t)] / σroll(t)
- x(t)
- The current observation
- μroll(t)
- The recent rolling mean
- σroll(t)
- The recent rolling standard deviation
- Positive values indicate above-baseline activity
- Negative values indicate below-baseline activity
R(t) = w₁z₁(t) + w₂z₂(t) + w₃z₃(t)
R(t) =
- wastewater contribution
- +hospital contribution
- +environmental contribution
Weights are normalized and adjustable in the prototype.
Raw values cannot be directly added
copies per liter + admissions + AQI
Standardized values can be compared
z-score + z-score + z-score
Scenarios
Stress-testing the sensing logic
Wastewater
Hospital admissions
Environment
Fused risk
Alert timeline for this scenario: mostly Baseline days.
- Signals fluctuate around recent norms
- Risk remains near or below zero
- Few or no elevated alerts
Verify that normal variability does not constantly trigger alarms.
The scenario represents an unusual synthetic anomaly pattern, not a validated method for identifying deliberate biological attacks.
Dashboard
A walkthrough of the Streamlit interface
Data sources
- Upload wastewater CSV
- Upload hospital CSV
- Upload environmental CSV
- Or load packaged synthetic scenarios
The application attempts to identify date and numeric columns automatically, with user selection when ambiguity exists.
Detection parameters
- Rolling window
- Signal weights
- Medium threshold
- High threshold
Weights are normalized before fusion.
Summary
- Days in dataset
- Number of high-alert days
- Number of medium-alert days
- Number of low-alert days
Raw trends
- The three original signals in their native units
Standardized signals
- All z-scores and the fused risk index on a comparable scale
Alerts
- Date
- Fused risk
- Alert tier
- Downloadable CSV
An alert should explain itself
Decision-makers should see not only that risk increased, but why.
Example decomposition
Alert tiers
Baseline
Risk below the low-alert region or below zero.
No meaningful synchronized elevation.
Low
Small or early deviation.
Observe and continue monitoring.
Medium
Multiple signals or stronger deviation.
Review data quality and consider enhanced surveillance.
High
Strong fused anomaly above the configured threshold.
Escalate for expert review under an operational protocol.
The prototype exposes configurable thresholds; it does not establish clinically or operationally validated alert cutoffs.
Architecture
What the prototype implements
Input layer
- Uploaded CSVs
- Packaged scenarios
- Date-column detection
- Numeric-column detection
Processing layer
- Cleaning
- Alignment
- Rolling mean
- Rolling standard deviation
- Per-stream z-scores
Fusion layer
- Weight normalization
- Weighted risk calculation
- Threshold comparison
- Alert assignment
Presentation layer
- Raw trends
- Standardized trends
- Fused risk curve
- Summary metrics
- Alert table
- CSV export
Application layer
- Python
- Pandas
- Streamlit
Data contract
| Input | Required content | Example value |
|---|---|---|
| Wastewater CSV | Date and numeric viral-load field | RNA copies per liter |
| Hospital CSV | Date and numeric admissions field | Daily admissions |
| Environment CSV | Date and numeric environmental field | AQI or PM2.5 |
| Scenario mode | One packaged synthetic configuration | Baseline, outbreak, bioterror |
- Wastewater CSV
- Date and numeric viral-load field
- RNA copies per liter
- Hospital CSV
- Date and numeric admissions field
- Daily admissions
- Environment CSV
- Date and numeric environmental field
- AQI or PM2.5
- Scenario mode
- One packaged synthetic configuration
- Baseline, outbreak, bioterror
- Automatic date-column detection
- Automatic numeric-column detection where unambiguous
- User selection when multiple numeric columns exist
Production ingestion would require formal schemas, quality metadata, provenance, and missing-data handling.
Prototype versus operational system
Current prototype
- Synthetic or manually uploaded data
- Single-region analysis
- Rolling z-scores
- User-adjustable weights
- Rule-based thresholds
- Streamlit dashboard
- Manual exploration
- CSV export
Proposed operational capability
- Automated data connectors
- Multiple regions
- Data-quality scoring
- Historical and adaptive baselines
- Probabilistic anomaly detection
- Forecasting
- Secure role-based access
- Alert routing
- Human review workflows
- Auditing and model-version tracking
- Federated regional nodes
Proposed future architecture
Proposed future architecture — not implemented
Data providers
- Wastewater utilities
- Hospital systems
- Clinical laboratory feeds
- Environmental networks
- Syndromic surveillance
- Genomic sequencing
- Additional approved sources
Regional ingestion
- APIs
- Scheduled jobs
- Common schema
- Metadata and provenance
- Quality checks
- De-identification
Regional analytics
- Rolling baselines
- Anomaly detection
- Forecasting
- Signal fusion
- Uncertainty estimation
Federated coordination
- Regional summaries
- Cross-region comparisons
- Shared risk standards
- Central coordination hub
Decision support
- Public-health users
- Emergency managers
- Approved biodefense stakeholders
- Expert review
- Alert routing
Governance
- Access controls
- Model audit logs
- Threshold governance
- Privacy safeguards
- Independent oversight
Scaling
A phased national scaling roadmap
Phase 1
Regional pilots
Scope
- Cities or states with mature wastewater surveillance
- Reliable hospital reporting
- Accessible environmental monitoring
Goals
- Validate ingestion
- Calibrate thresholds
- Test operational workflows
- Compare alerts against known historical events
Phase 2
Broader coverage
Scope
- Additional states
- Rural communities
- Tribal nations
- Territories
- Diverse infrastructure environments
Goals
- Handle missing data
- Handle delayed reporting
- Improve resilience
- Train local users
- Standardize interfaces
Phase 3
Federated national network
Scope
- Regional nodes maintain local models and context
- Shared standards define data and risk outputs
- A central coordination hub receives summarized signals
- Cross-regional anomalies can be detected
Goals
- Preserve local autonomy
- Enable national situational awareness
- Support cross-jurisdictional detection
Governance
Detection is only useful when institutions know what to do next
Ownership
- Who operates the system?
- Who maintains the data pipelines?
- Who approves model changes?
- Who is accountable for failures?
Alert authority
- Who may change thresholds?
- Which signals remain internal?
- What requires expert review?
- What triggers escalation?
Privacy and civil liberties
- Aggregation
- De-identification
- Strict access control
- Purpose limitation
- Community transparency
- Prevention of community stigmatization
Oversight
- Audit trails
- Ethics review
- Community advisory input
- Model-change documentation
- Periodic retrospective evaluation
This is presented as a required governance design problem, not a claim that any single institution has been confirmed as the system's owner.
Risks
What could go wrong?
| Failure mode | Risk | Potential mitigation |
|---|---|---|
| False positive | Unnecessary escalation and loss of trust | Expert review, multiple-stream confirmation, calibrated thresholds |
| False negative | Missed early warning | Redundant data sources, high-sensitivity internal screening |
| Missing or delayed data | Distorted risk score | Quality flags, imputation policy, source-health monitoring |
| One noisy stream dominates | Misleading fused risk | Weight caps, contribution display, robust fusion |
| Baseline drift | Normal change appears anomalous | Adaptive baselines and retrospective recalibration |
| Feed manipulation | Artificial or hidden anomaly | Source redundancy and integrity monitoring |
| Model or threshold changes | Untraceable decision shifts | Versioning, audit logs, approval workflows |
| Community stigmatization | Unequal social harm | Aggregation, governance, careful public communication |
| Alert fatigue | Users stop responding | Tiered review, suppression logic, performance monitoring |
- False positive
- Unnecessary escalation and loss of trust
- Expert review, multiple-stream confirmation, calibrated thresholds
- False negative
- Missed early warning
- Redundant data sources, high-sensitivity internal screening
- Missing or delayed data
- Distorted risk score
- Quality flags, imputation policy, source-health monitoring
- One noisy stream dominates
- Misleading fused risk
- Weight caps, contribution display, robust fusion
- Baseline drift
- Normal change appears anomalous
- Adaptive baselines and retrospective recalibration
- Feed manipulation
- Artificial or hidden anomaly
- Source redundancy and integrity monitoring
- Model or threshold changes
- Untraceable decision shifts
- Versioning, audit logs, approval workflows
- Community stigmatization
- Unequal social harm
- Aggregation, governance, careful public communication
- Alert fatigue
- Users stop responding
- Tiered review, suppression logic, performance monitoring
High-sensitivity analytic flags should not automatically become public alerts.
My role
Built end to end, on my own
Unlike the team projects elsewhere in this portfolio, this one was mine alone: I founded it, and I conceived, designed, and built every part of it myself — the framing and use case, the detection pipeline, the interactive dashboard, and both the technical report and the strategic brief.
Concept and strategy
- Developed the “digital immune system” framing for early biological-threat detection
- Defined the initial use case connecting public health and biosecurity
- Translated the concept into a staged prototype and national-scaling strategy
System design
- Designed the multi-signal processing pipeline
- Defined the rolling-baseline, standardization, weighted-fusion, and alert workflow
- Structured the system so that additional signals can be incorporated later
Implementation
- Built the interactive Python and Streamlit dashboard
- Implemented CSV upload, scenario selection, parameter controls, time-series visualizations, risk scoring, and alert export
Data visualization
- Designed views for raw signals, standardized anomalies, fused risk, and alert tiers
- Prioritized interpretability so users can inspect what drives an elevated risk score
Strategic communication
- Authored the technical report
- Authored the strategic brief describing national architecture, governance, scaling, and risk management
Technical and strategic decisions
Decision 1
Use z-scores instead of raw values
Reason
The three inputs have different units and ranges.
Tradeoff
Z-scores are interpretable but sensitive to baseline-window choice and unusual variance.
Decision 2
Start with explicit weighted fusion
Reason
A transparent linear model makes signal contributions visible and easy to adjust.
Tradeoff
It cannot model complex nonlinear relationships or learn weights automatically.
Decision 3
Use synthetic scenarios
Reason
Synthetic data supports controlled testing without depending on restricted or unreliable live feeds.
Tradeoff
It does not prove real-world detection performance.
Decision 4
Pair technical prototyping with governance design
Reason
A biosurveillance system can create harm even when the code works correctly.
Tradeoff
Operational value depends on institutions, oversight, and response protocols beyond the dashboard itself.
Reflection
What this experiment does — and does not — establish
What the prototype demonstrated
- Heterogeneous time-series inputs can be aligned and visualized in one workflow
- Rolling z-scores can place different signals on a common scale
- Adjustable weights can combine signal evidence into a fused score
- Thresholds can convert continuous risk into understandable alert tiers
- Synthetic scenarios can demonstrate baseline and anomaly behavior
- Users can inspect raw signals, standardized signals, and alert outputs
- The modular structure supports future data sources and models
Not claimed
- Early detection accuracy
- Sensitivity or specificity
- Lead time over existing systems
- Pathogen attribution
- Operational deployment
- Reduced mortality
- National-security effectiveness
From demonstration to defensible capability
Data
- Automated wastewater feeds
- Hospital and laboratory integrations
- EPA AirNow or OpenAQ-style environmental feeds
- Syndromic surveillance
- Genomic sequencing
- Data provenance and quality scoring
Modeling
- Isolation Forest
- Local Outlier Factor
- Autoencoders
- Temporal forecasting
- Multimodal fusion
- Probabilistic risk
- Uncertainty estimates
Candidate approaches, not selected production methods.
Engineering
- Scheduled ingestion
- Secure cloud deployment
- Docker
- Continuous integration
- Role-based access control
- Monitoring
- Alert delivery
- Model and threshold versioning
Validation and governance
- Historical outbreak backtesting
- Prospective pilot evaluation
- False-positive analysis
- Human factors studies
- Privacy review
- Community engagement
- Operational exercises
Tech & topics
- Python
- Streamlit
- Pandas
- Time-Series Analysis
- Rolling Statistics
- Anomaly Detection
- Data Fusion
- Data Visualization
- Scenario Simulation
- Biosecurity
- Public-Health Surveillance