HONORS THESIS · BIOENGINEERING · 2026
Virtual Stenting in the Fontan Circulation
Hemodynamic Effects of Virtual Stenting at Rest and During Exercise
A patient-specific computational study of how virtual pathway enlargement changes pressure burden and flow efficiency in the Fontan circulation.
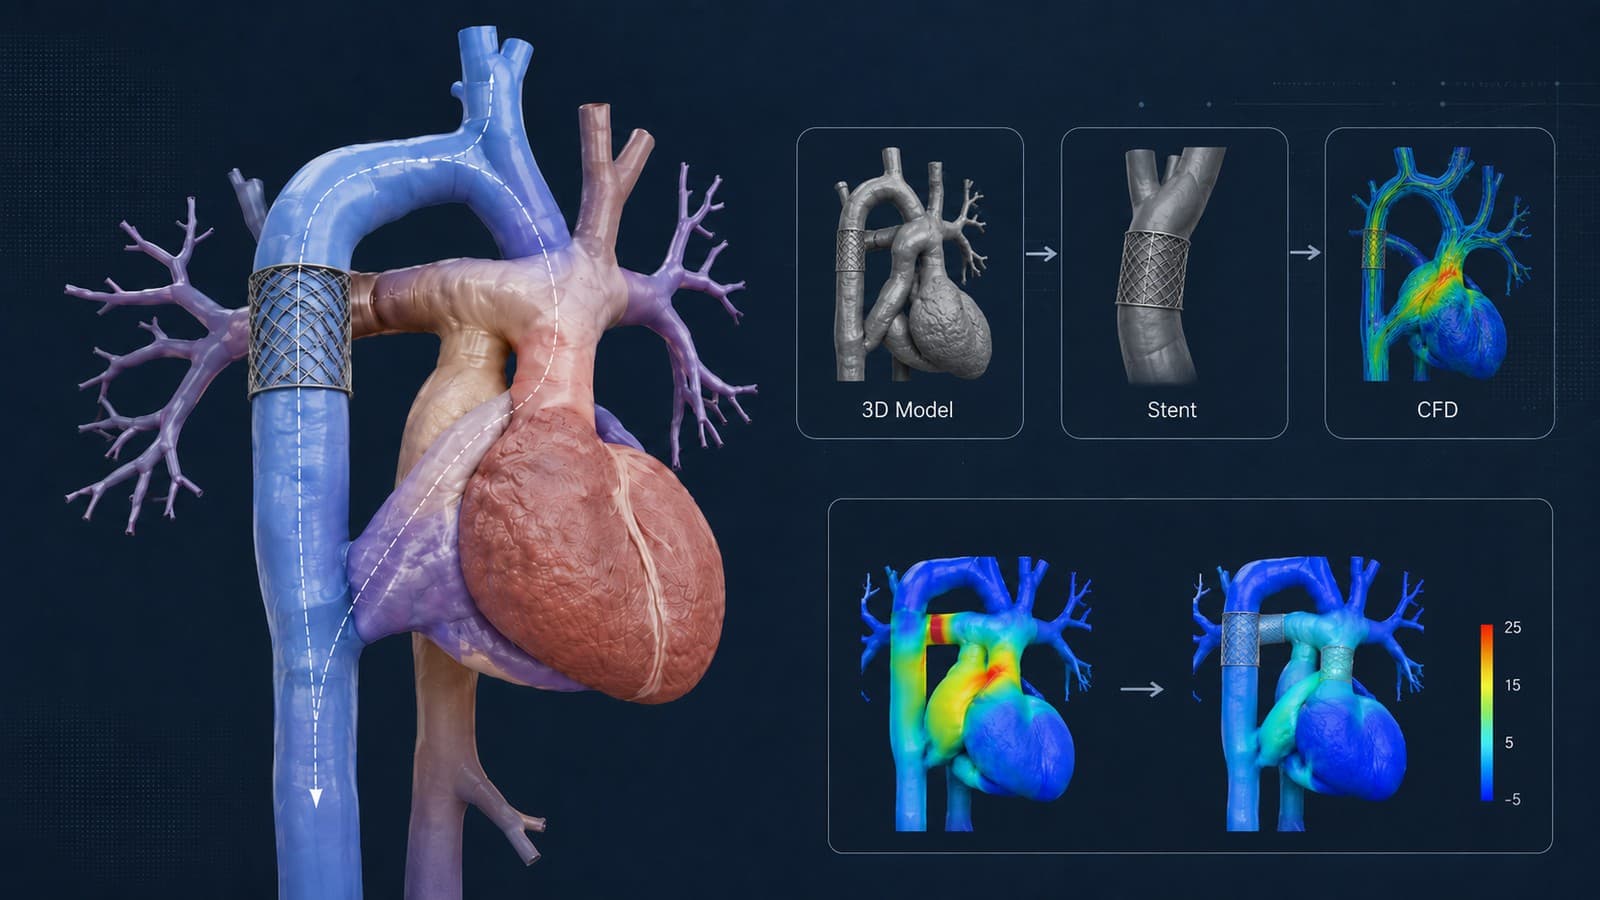
I independently reconstructed vascular anatomies from 4D flow MRI, generated virtual post-stent models, created simulation-ready meshes, and ran transient CFD under resting and exercise conditions.
Independently executed honors thesis under faculty and laboratory mentorship.
- Role
- Sole Student Researcher
- Thesis
- Stanford Bioengineering Honors
- Advisor
- Dr. Alison Marsden
- Year
- 2026
Fontan anatomies reconstructed and screened
Patients selected for detailed analysis
Final pre/post and rest/exercise simulation states
Time steps per transient simulation
Three cases were selected from the larger reconstructed cohort for detailed paired virtual-intervention analysis.
Overview
One patient, four computational states
I developed a patient-specific computational pipeline to evaluate how virtual stent placement alters Fontan hemodynamics at rest and during exercise. Starting from 4D flow MRI, I reconstructed three-dimensional vascular anatomy, generated virtual post-stent geometries, created volumetric meshes, ran transient CFD simulations, and compared pressure drop, power loss, and resistance before and after intervention.
Virtual stenting cut pressure drop 34.4–97.9% and resistance 70.4–99.5% across all three modeled patients, but power loss rose 45.6% in one patient under exercise — showing that apparent anatomical narrowing alone does not guarantee a consistently favorable hemodynamic response.
The results support patient-specific simulation as a potential method for distinguishing patients who may benefit from pathway enlargement from those whose broader flow geometry may limit or complicate that benefit.
Physiology
A circulation without a subpulmonary ventricle
- In a normal circulation, a ventricle pumps blood through the lungs.
- In the Fontan circulation, systemic venous blood reaches the pulmonary arteries without a pumping ventricle.
- Pulmonary blood flow therefore depends on elevated venous pressure and low pathway resistance.
- Even modest narrowing can increase the pressure required to sustain flow.
- Patients have limited reserve when metabolic demand rises.
Normal circulation
- Venous return
- Right ventricle
- Pulmonary arteries
Fontan circulation
- Venous return
- Passive conduit
- Pulmonary arteries
Dashed outline marks the missing pumping chamber — flow passes through a passive conduit instead.
In a low-energy circulation, small geometric inefficiencies can have outsized consequences.
What appears modest at rest may become important during exercise
Rest
- Lower venous return
- Lower pathway flow
- Smaller pressure burden
- Some obstruction may remain partially hidden
Exercise
- IVC flow increases
- Cardiac cycle shortens
- Pathway demand rises
- Geometric inefficiencies become more consequential
The exercise simulation was a standardized moderate physiologic stress condition, not a patient-specific prediction of maximal exercise performance.
Question
Research question and hypothesis
Primary question
“Does virtual stent-related pathway enlargement consistently improve Fontan hemodynamics?”
Secondary question
“Does the apparent benefit change when flow demand increases during exercise?”
Outcomes
- Pressure drop
- Resistance
- Power loss
Within each patient, I held the remaining anatomy constant and compared the original and virtually enlarged pathways under matched resting and exercise boundary conditions.
Workflow
Full computational workflow
Reconstruction and boundary-condition work were manual; geometry processing and virtual stenting were semi-automated; meshing and simulation were computational; the final comparisons were analytical. No stage of this pipeline ran unattended.
Turning clinical imaging into simulation-ready anatomy
Imaging volume
The selected anatomical volume from the 4D flow MRI dataset provided the basis for segmentation.
Vessel paths
I manually placed centerline paths through the superior vena cava, inferior vena cava, left and right pulmonary arteries, hepatic veins, and relevant branch vessels.
Cross-sectional contours
I created and corrected lumen contours along each vessel path.
Lofted vessels
Local contours were connected into continuous three-dimensional vessel surfaces.
Unified model
Individual vessel surfaces were unioned and blended at complex junctions.
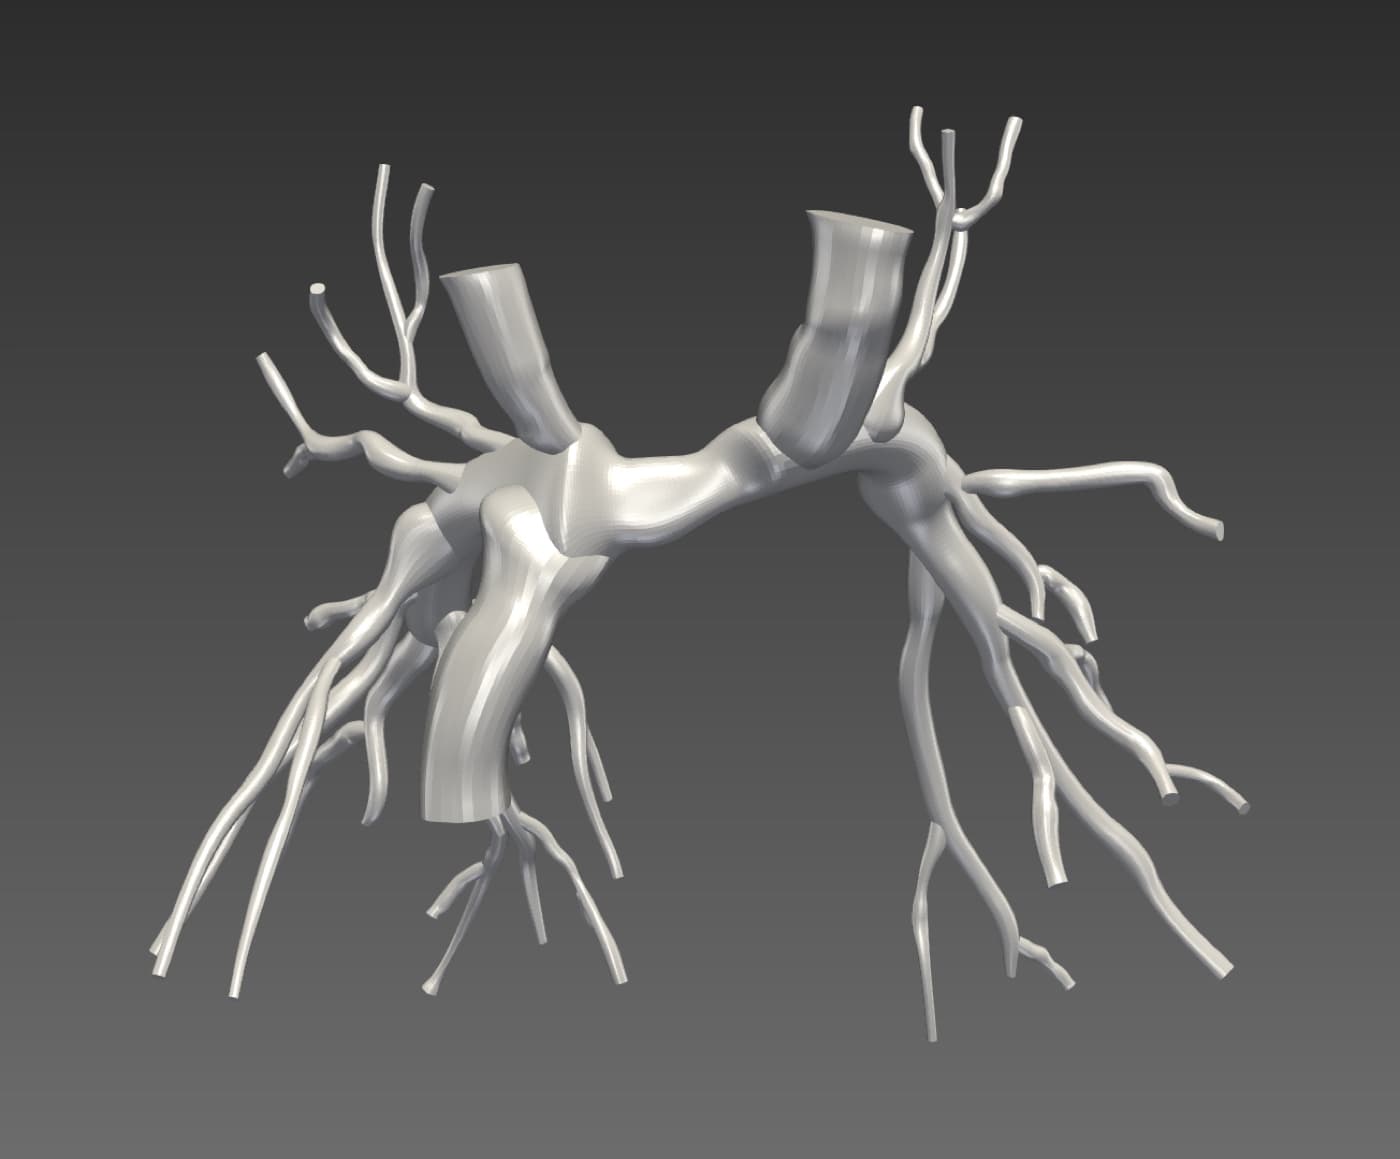
Truncated domain
Distal anatomy outside the region of interest was removed to focus the simulation.
Watertight surface
Inlets and outlets were capped and assigned distinct boundary faces.
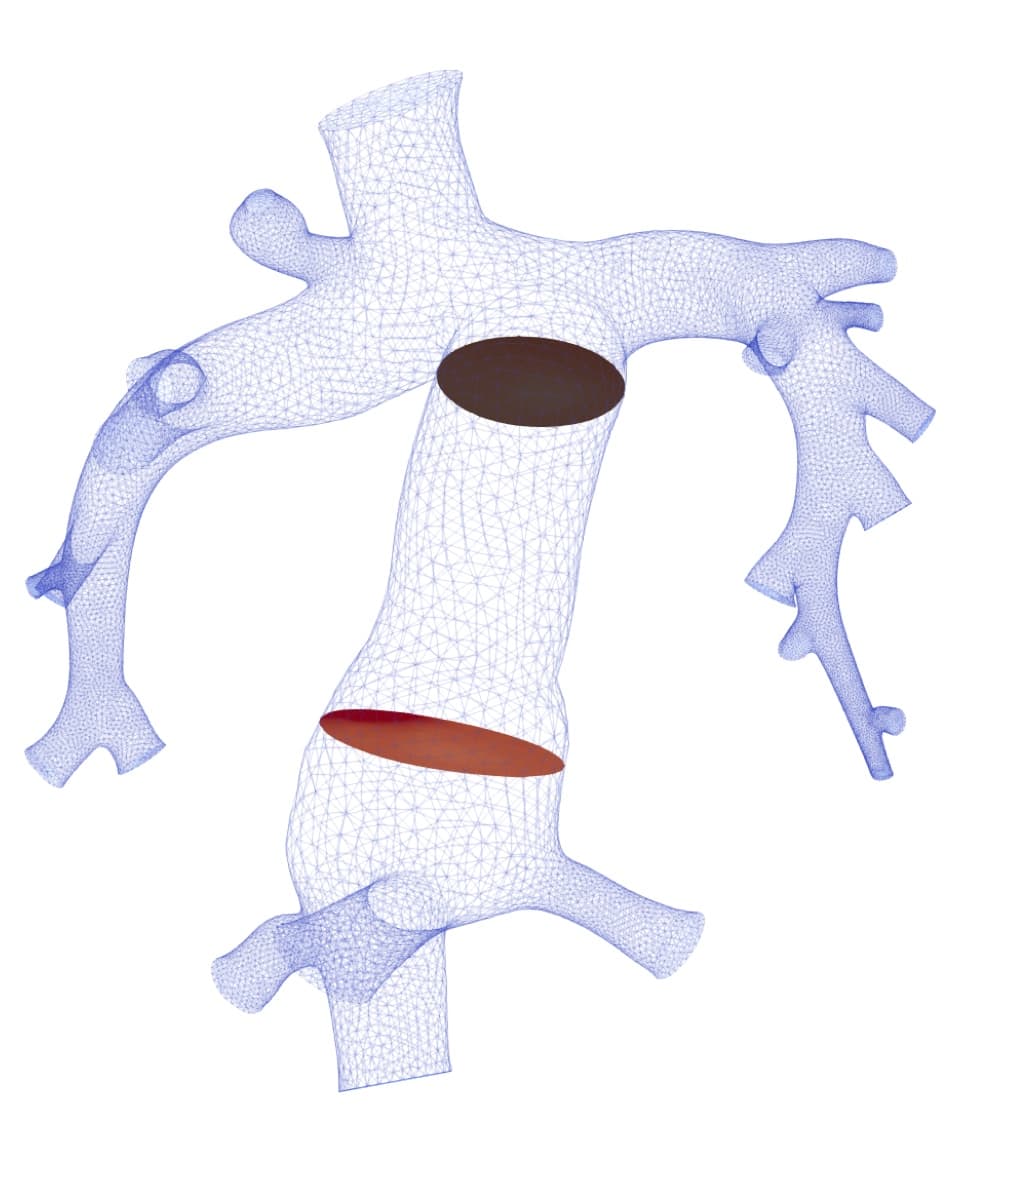
Tetrahedral volume mesh
The final fluid domain was discretized for finite-element simulation.
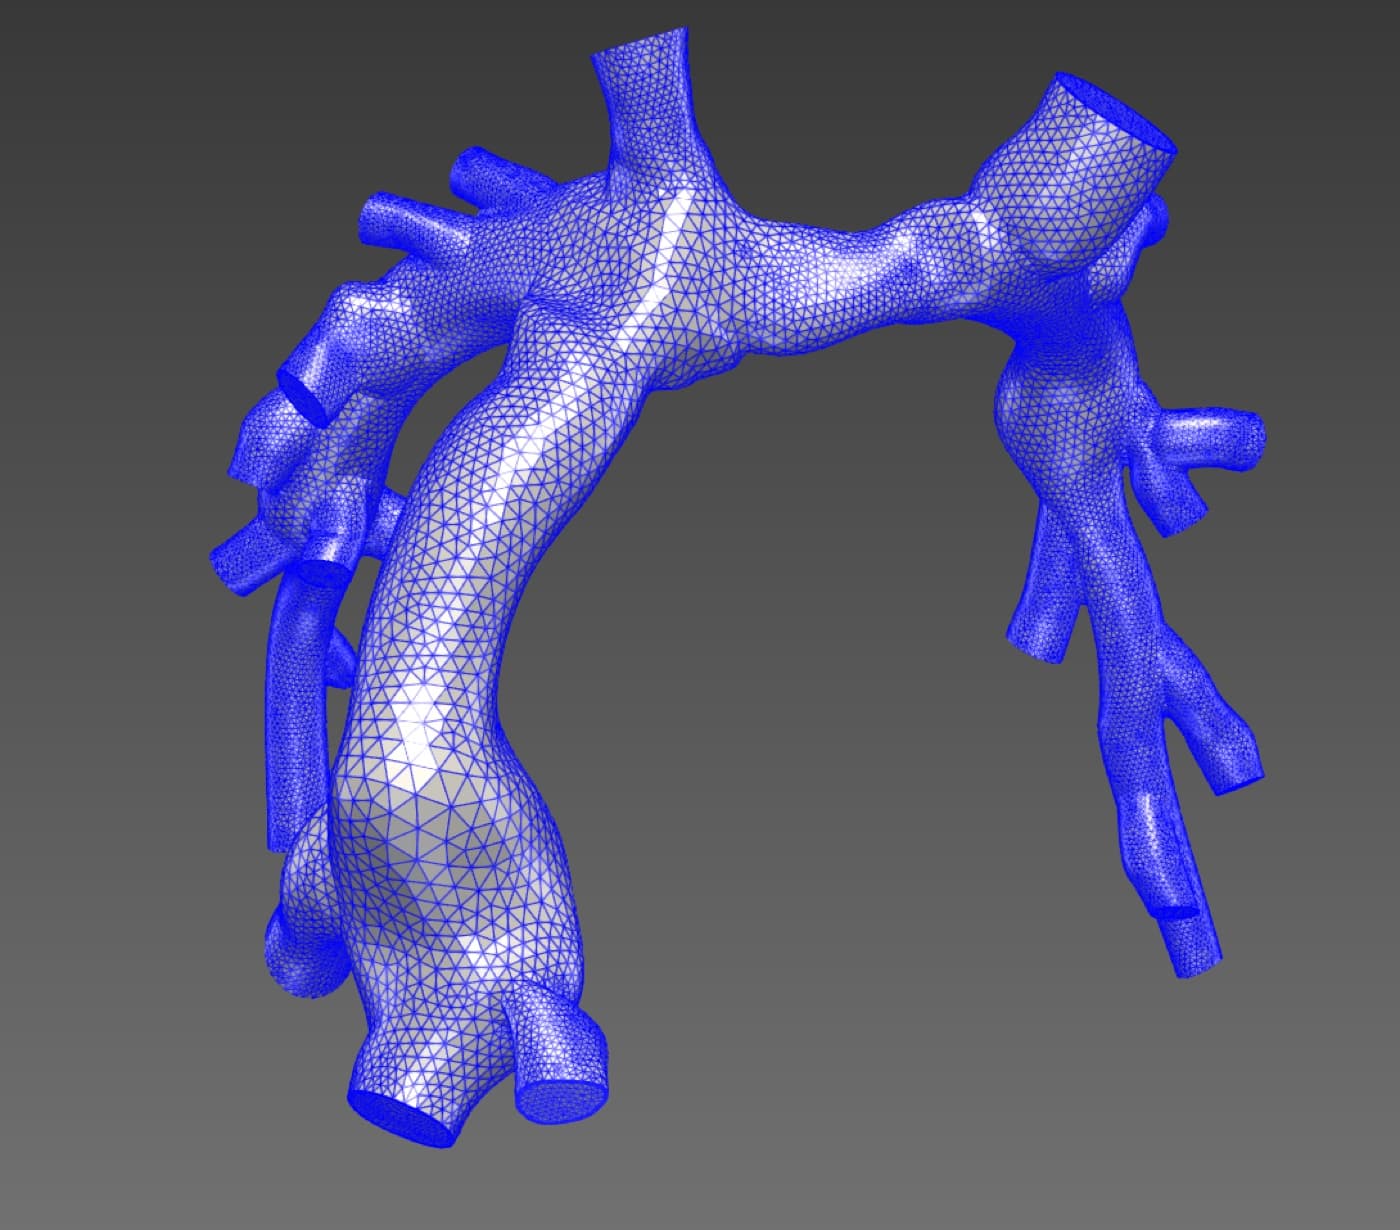
Centerline extraction
A centerline was computed through the reconstructed model and used to guide the virtual intervention described next.
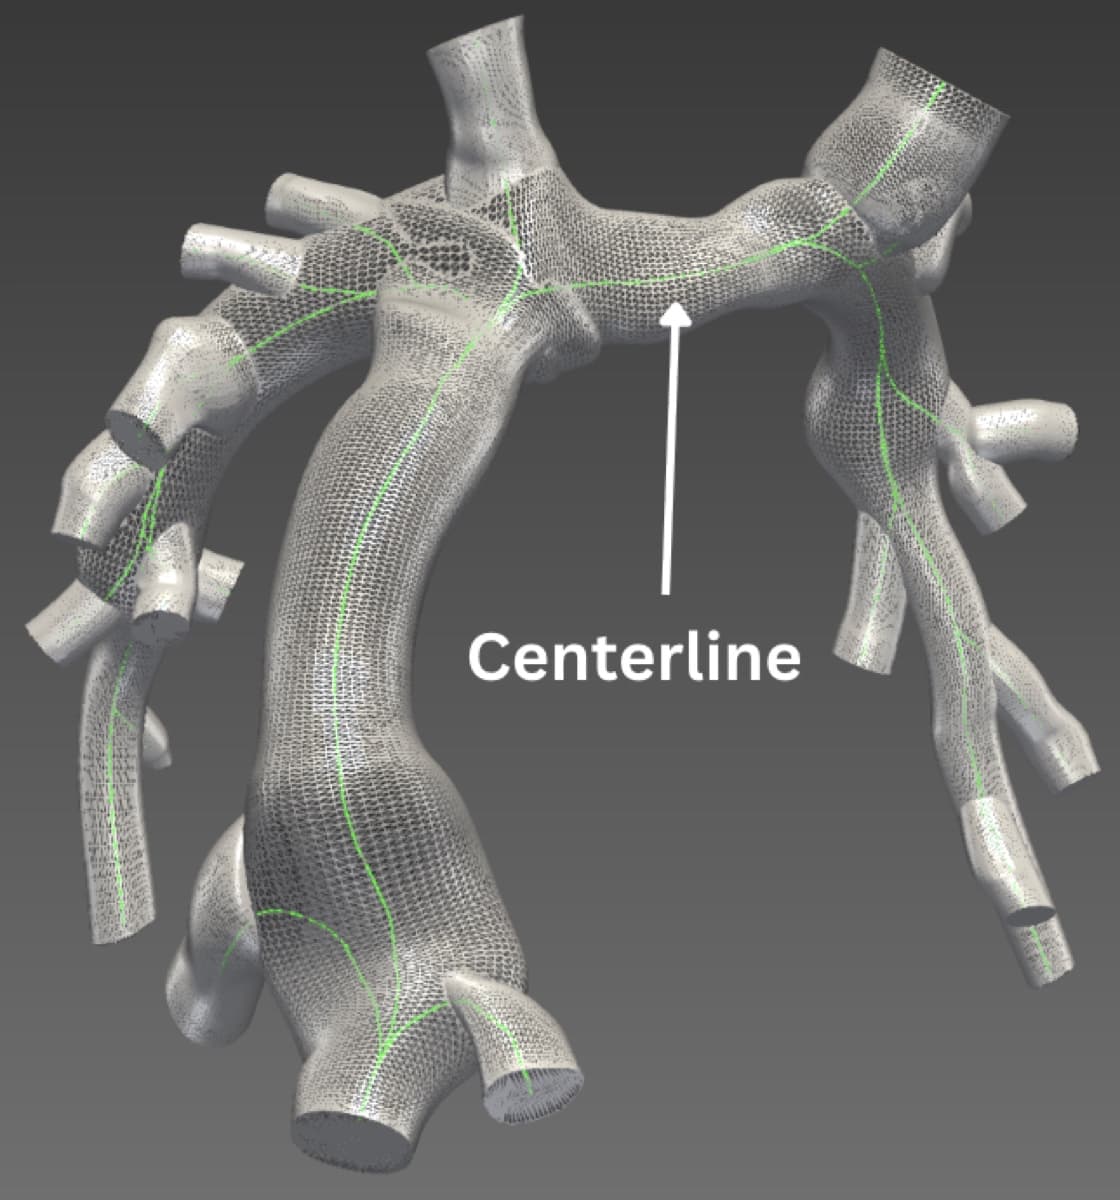
Complex postsurgical anatomy required dense manual correction around narrowing, branches, and junctions where automated segmentation was unreliable.
Stenting
Testing the intervention without changing the patient
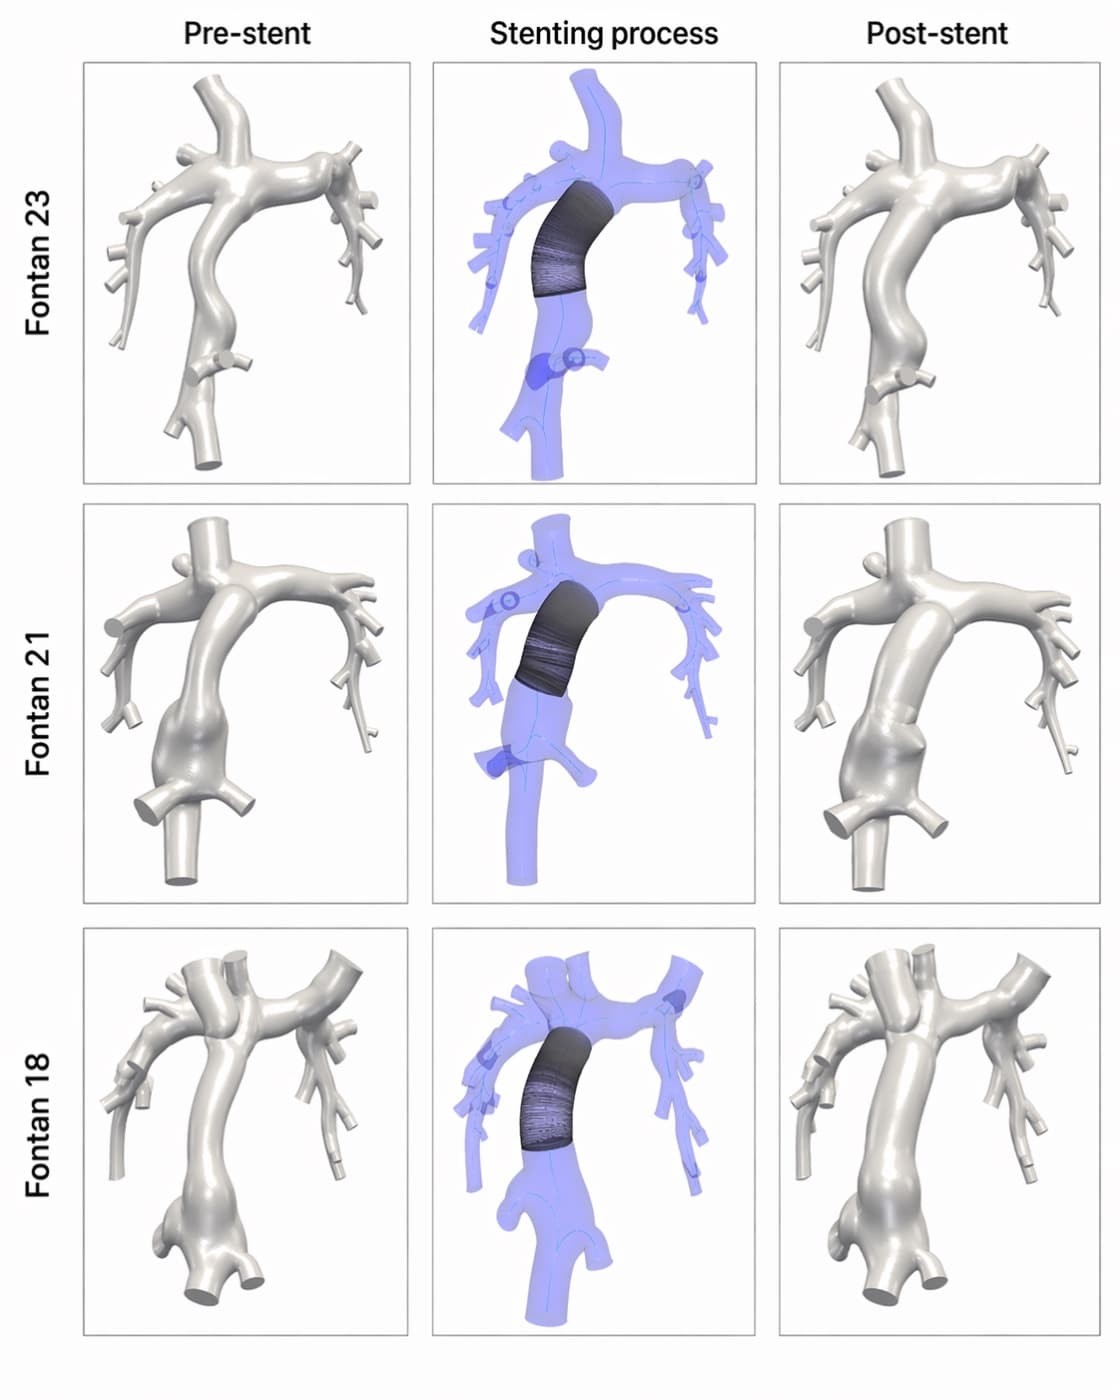
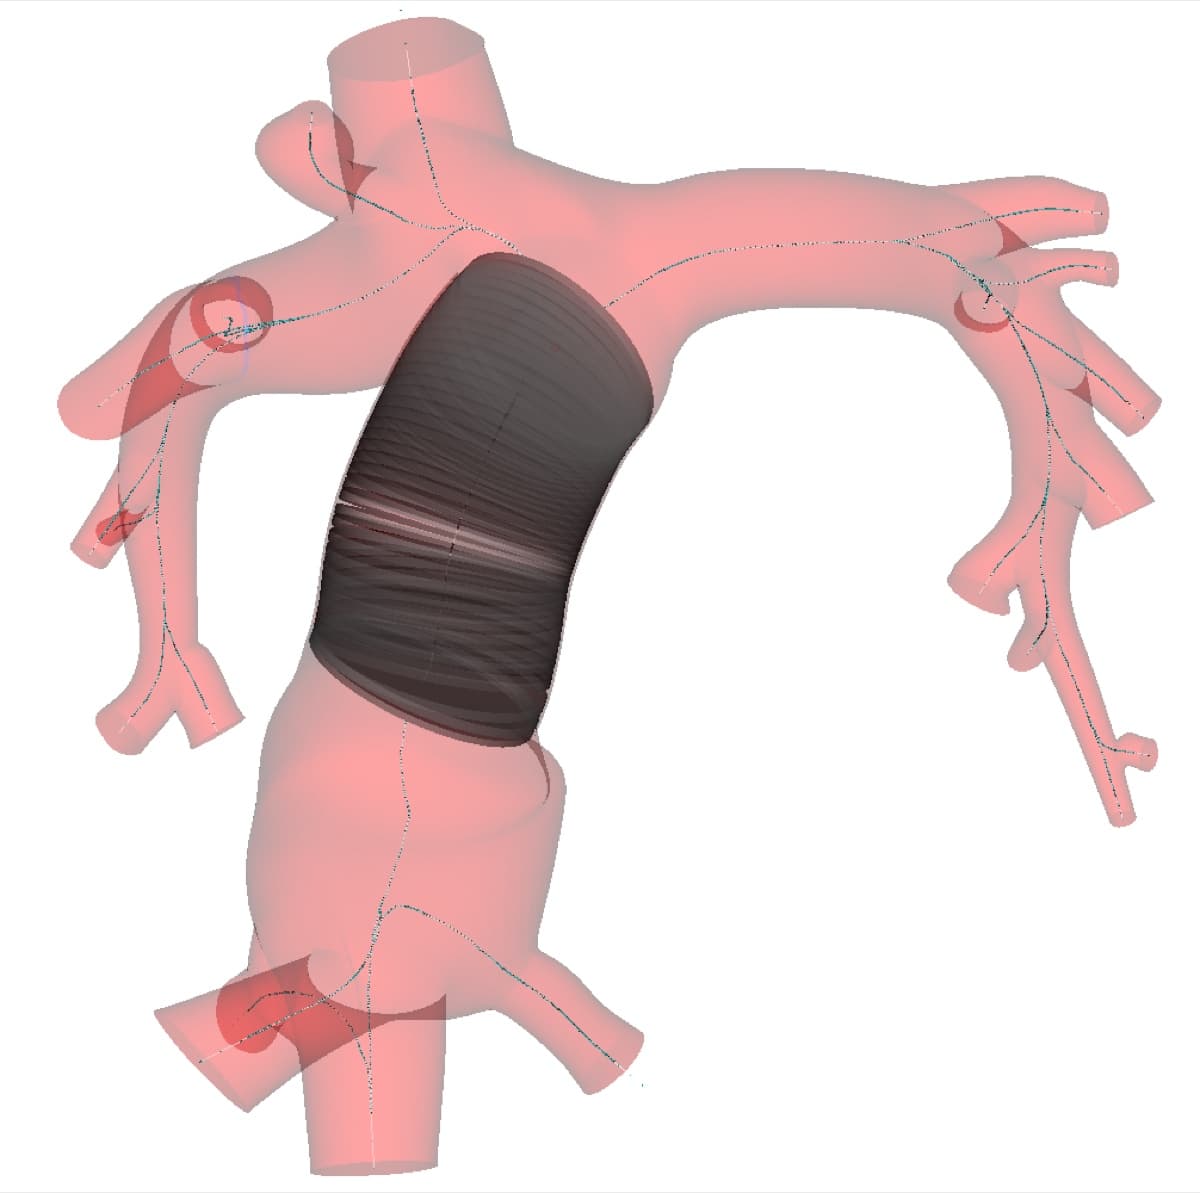
- 01Generate a centerline from the original Fontan model
- 02Identify the narrowed or distorted target segment
- 03Select the intervention axis
- 04Adjust virtual stent length and diameter
- 05Expand the lumen until focal narrowing is removed
- 06Export the deformed post-stent geometry
- 07Rebuild a simulation-ready mesh
- 08Compare it with the original anatomy
The virtual model represents the enlarged luminal geometry, not the mechanical structure or deployment physics of the stent itself.
Study cohort and selection
- 15 reconstructed Fontan anatomies
- Preliminary geometric and hemodynamic review
- 3 selected cases
- 4 states per patient
- 12 paired simulations
- The fifteen cases were reviewed for anatomies where pathway enlargement had a plausible mechanistic rationale.
- Three patients were selected for detailed study.
- The purpose was in-depth within-patient comparison rather than population-level statistical inference.
Simulations
Simulation experiment matrix
Patient 18
Patient 21
Patient 23
Simulation configuration
| Parameter | Study configuration |
|---|---|
| Solver | SimVascular finite-element framework |
| Simulation type | Transient three-dimensional fluid simulation |
| Time step | 0.001 seconds |
| Time steps | 32,000 |
| Blood model | Incompressible Newtonian fluid |
| Density | 1.06 g/cm³ |
| Dynamic viscosity | 0.04 P |
| Vessel walls | Rigid |
| Wall condition | No slip |
| Inlets | Pulsatile imposed-flux waveforms |
| Outlets | Branch-specific three-element RCR Windkessel models |
| Analysis cycle | Sixth cardiac cycle |
| Primary outcomes | Pressure drop, resistance, power loss |
- Solver
- SimVascular finite-element framework
- Simulation type
- Transient three-dimensional fluid simulation
- Time step
- 0.001 seconds
- Time steps
- 32,000
- Blood model
- Incompressible Newtonian fluid
- Density
- 1.06 g/cm³
- Dynamic viscosity
- 0.04 P
- Vessel walls
- Rigid
- Wall condition
- No slip
- Inlets
- Pulsatile imposed-flux waveforms
- Outlets
- Branch-specific three-element RCR Windkessel models
- Analysis cycle
- Sixth cardiac cycle
- Primary outcomes
- Pressure drop, resistance, power loss
Numerical solver details
Nonlinear convergence
Each time step was iterated until the nonlinear residual met the solver's convergence tolerance before advancing.
Backflow stabilization
Outlet backflow stabilization was applied to prevent divergence from transient flow reversal at branch outlets.
Krylov-based linear solves
The linear systems at each nonlinear iteration were solved with a Krylov-subspace iterative method.
Boundary-condition tuning
RCR parameters were iteratively adjusted so simulated flow splits and mean pressures matched available patient data.
Rest and exercise conditions
Rest
- Patient-specific venous inflow waveforms
- Patient-specific pulmonary outlet conditions
- Clinical pressure and flow information used for tuning
Moderate exercise
- Mean IVC inflow: 3× resting value
- Mean SVC inflow: unchanged
- Pulmonary outlet resistance: reduced by 10%
- Heart rate: 120 beats per minute
The exercise prescription was derived from prior Fontan CFD studies and used as a standardized moderate-stress condition.
Grounding the simulations in patient data
Boundary conditions were adjusted so the simulations reproduced these available clinical observations — described here as patient-data-informed calibration and physiologic consistency checks, not as a clinically validated model.
Metrics
Hemodynamic metrics
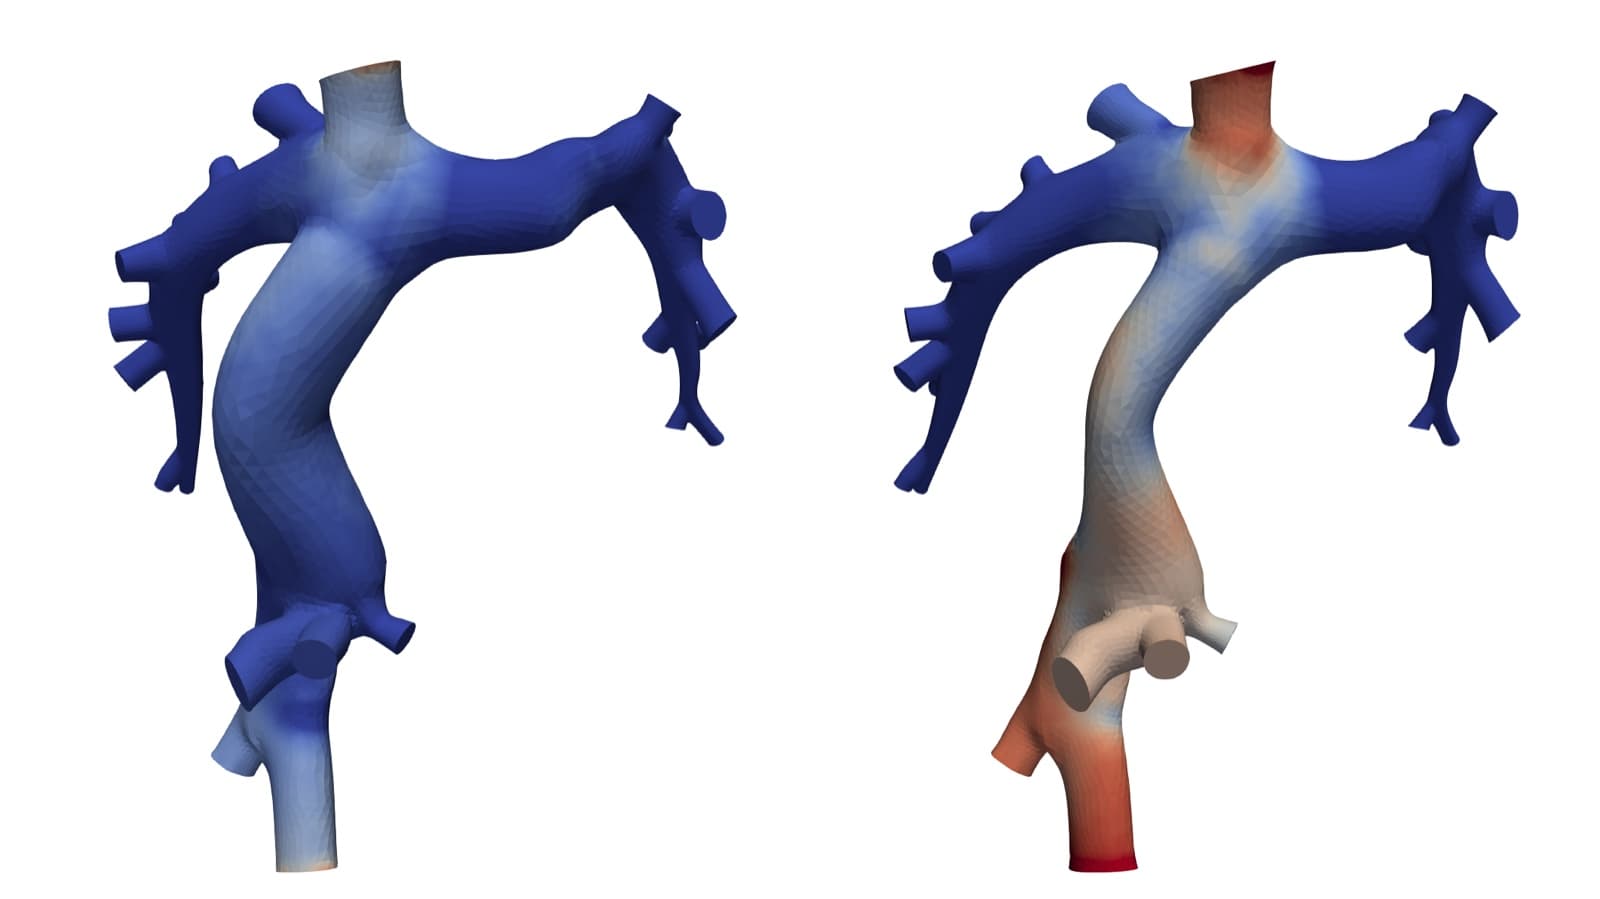
Pressure drop
“How much pressure is required to move blood across the Fontan pathway?”
Difference between area-averaged inflow and outflow pressure.
Clinical relevance
Higher pressure burden may require greater upstream venous pressure.
Resistance
“How strongly does the pathway oppose flow?”
Summarizes pathway opposition relative to the amount of flow, also expressed as a percentage of pulmonary vascular resistance.
R = ΔP / Q
Clinical relevance
Higher effective resistance means the pathway itself consumes a larger share of the total resistance the circulation must overcome.
Power loss
“How much mechanical energy is dissipated as blood traverses the connection?”
Rate of mechanical energy dissipated by the pathway geometry.
Clinical relevance
Captures energetic inefficiency that pressure drop alone may not reveal.
No single metric fully described the intervention response.
Results
Interactive patient-results explorer
Patient 18
Mixed responseRest
| Metric | Pre-stent | Post-stent | Change |
|---|---|---|---|
| Pressure drop | 0.240 mmHg | 0.0682 mmHg | −71.6% |
| Power loss | 0.000267 W | 0.000343 W | +28.5% |
| Resistance | 38.38 dyn·s/cm⁵ | 2.41 dyn·s/cm⁵ | −93.7% |
| Resistance as % PVR | 28.2% | 1.8% | — |
- Pressure drop
- Pre: 0.240 mmHgPost: 0.0682 mmHg
- Change: −71.6%
- Power loss
- Pre: 0.000267 WPost: 0.000343 W
- Change: +28.5%
- Resistance
- Pre: 38.38 dyn·s/cm⁵Post: 2.41 dyn·s/cm⁵
- Change: −93.7%
- Resistance as % PVR
- Pre: 28.2%Post: 1.8%
- Change: —
Exercise
| Metric | Pre-stent | Post-stent | Change |
|---|---|---|---|
| Pressure drop | 0.292 mmHg | 0.192 mmHg | −34.4% |
| Power loss | 0.000543 W | 0.000790 W | +45.6% |
| Resistance | 28.00 dyn·s/cm⁵ | 8.28 dyn·s/cm⁵ | −70.4% |
| Resistance as % PVR | 20.6% | 6.1% | — |
- Pressure drop
- Pre: 0.292 mmHgPost: 0.192 mmHg
- Change: −34.4%
- Power loss
- Pre: 0.000543 WPost: 0.000790 W
- Change: +45.6%
- Resistance
- Pre: 28.00 dyn·s/cm⁵Post: 8.28 dyn·s/cm⁵
- Change: −70.4%
- Resistance as % PVR
- Pre: 20.6%Post: 6.1%
- Change: —
Interpretation
- Pressure drop and resistance improved.
- Power loss increased at both physiologic states.
- The more complex venous anatomy likely altered how flow reorganized after pathway enlargement.
- This was not a uniformly favorable hemodynamic response.
Percent change after virtual stenting
- Pressure drop
- Resistance
- Power loss
| Patient | State | Pressure drop | Resistance | Power loss |
|---|---|---|---|---|
| Patient 18 | Rest | -71.6% | -93.7% | +28.5% |
| Patient 18 | Exercise | -34.4% | -70.4% | +45.6% |
| Patient 21 | Rest | -80.5% | -93.3% | -43.0% |
| Patient 21 | Exercise | -89.1% | -98.1% | -37.3% |
| Patient 23 | Rest | -86.9% | -97.3% | -37.7% |
| Patient 23 | Exercise | -97.9% | -99.5% | -8.9% |
Pre-versus-post paired values
| Patient | State | Pre-stent (mmHg) | Post-stent (mmHg) |
|---|---|---|---|
| Patient 18 | Rest | 0.24 | 0.0682 |
| Patient 18 | Exercise | 0.292 | 0.192 |
| Patient 21 | Rest | 0.51 | 0.1 |
| Patient 21 | Exercise | 2.115 | 0.231 |
| Patient 23 | Rest | 0.217 | 0.0284 |
| Patient 23 | Exercise | 0.903 | 0.019 |
Interpretation
Exercise changed the magnitude — but not always the direction — of response
Patient 21
- Pressure-drop reduction: 80.5% at rest → 89.1% during exercise
- Resistance reduction: 93.3% at rest → 98.1% during exercise
Patient 23
- Pressure-drop reduction: 86.9% at rest → 97.9% during exercise
- Resistance reduction: 97.3% at rest → approximately 99.5% during exercise
Patient 18
- Pressure-drop reduction became smaller during exercise
- Resistance still improved
- Power loss increased further during exercise
Higher-flow conditions amplified the predicted benefit in two patients, but they also made the mixed response in the third case more apparent.
Why a wider pathway was not automatically a more efficient pathway
Patient 18 deep dive
Anatomical complexity
- More complex venous anatomy
- Azygous return
- Prior hepatic-vein connection to the Fontan graft
- Multiple competing flow streams
What changed after enlargement
- Enlarged pathway
- Reduced pressure burden
- Increased power dissipation
Proposed mechanism — not a proven causal pathway
Minimum diameter alone did not predict the complete hemodynamic response.
Main findings
Finding 1
Virtual stenting reduced pressure drop in all three patients at rest and during exercise.
Finding 2
Effective pathway resistance also decreased in all three patients.
Finding 3
Power loss was patient-specific: it decreased in Patients 21 and 23 but increased in Patient 18.
Finding 4
Exercise analysis revealed differences that were not fully captured by resting results alone.
The same geometric intervention produced three distinct hemodynamic profiles.
My role
What independent thesis work involved
Research framing
- Reviewed Fontan physiology, pathway obstruction, stenting, and prior computational studies
- Defined the research question and study design
- Selected outcome metrics and comparison strategy
Medical image reconstruction
- Reviewed 4D flow MRI datasets
- Created vessel paths
- Produced and corrected cross-sectional segmentations
- Lofted and unioned vascular surfaces
- Cleaned complex junctions
- Truncated and capped computational domains
Computational geometry
- Generated centerlines
- Identified target segments
- Created virtual post-stent geometries in svMorph
- Prepared paired pre-stent and post-stent models
Meshing and simulation
- Generated volumetric tetrahedral meshes
- Assigned inlet and outlet faces
- Configured transient simulations
- Applied patient-specific and exercise boundary conditions
- Troubleshot model and solver issues
- Verified convergence and usable simulation states
Analysis
- Extracted pressure and flow results
- Calculated pressure drop
- Calculated resistance
- Calculated power loss
- Compared pre-versus-post changes
- Interpreted rest-versus-exercise differences
Scientific communication
- Produced figures and tables
- Reviewed literature
- Wrote and revised the full honors thesis
- Defended the interpretation and limitations
- Prepared the thesis for faculty approval
This was not one isolated simulation. It was an end-to-end research workflow repeated across patient anatomies, intervention states, and physiologic conditions.
Research timeline
This ran as a roughly year-long process, from initial literature grounding through final thesis defense.
Phase 1
Clinical and literature grounding
Fontan physiology, stenting, and computational-planning literature.
Phase 2
Cohort reconstruction
Fifteen patient-specific anatomical models.
Phase 3
Case screening
Geometric and preliminary hemodynamic review.
Phase 4
Virtual intervention
Three paired post-stent geometries.
Phase 5
Simulation campaign
Rest and exercise, pre and post.
Phase 6
Quantitative analysis
Pressure drop, resistance, power loss.
Phase 7
Thesis synthesis
Interpretation, limitations, figures, tables, writing, revision.
Technical challenges and decisions
Challenge 1
Postsurgical anatomy resisted automatic segmentation
Decision
Use path-based cross-sectional reconstruction with dense manual correction near narrowing and junctions.
Lesson
Small geometric artifacts could produce artificial flow disturbances or prevent successful meshing.
Challenge 2
Pre- and post-stent comparisons needed to isolate geometry
Decision
Virtually deform only the targeted pathway while holding the remaining patient anatomy constant.
Lesson
This enabled a controlled within-patient comparison.
Challenge 3
The simulation domain omitted distal pulmonary anatomy
Decision
Represent distal vascular loading using branch-specific RCR Windkessel boundary conditions.
Lesson
The three-dimensional model could remain tractable while retaining downstream hemodynamic influence.
Challenge 4
Resting conditions might understate obstruction
Decision
Repeat every pre/post comparison under a standardized moderate-exercise condition.
Lesson
Higher flow revealed stronger effects in two patients and a more nuanced response in the third.
Challenge 5
Pressure drop alone could produce an incomplete conclusion
Decision
Evaluate pressure drop, resistance, and power loss together.
Lesson
Patient 18 improved in pressure-based metrics but worsened in energetic efficiency.
Limitations
What the simulations cannot yet establish
- Only three patients underwent detailed paired analysis
- Case selection was targeted rather than population representative
- The study was not designed for population-level inference
- Vessel walls were assumed rigid
- Blood was modeled as Newtonian
- Fluid–structure interaction was not included
- Boundary conditions were prescribed in an open-loop framework
- Whole-body circulatory feedback was not represented
- The post-stent models were virtual geometric deformations
- Stent mechanics and wall contact were not modeled
- Exercise was standardized rather than individually measured
- Quantitative absolute-pressure prediction is more limited than relative pressure-drop comparison
- Simulated benefit was not compared with actual postoperative outcomes
- Power-loss interpretation remains sensitive to broader flow organization and domain assumptions
The study was designed to test feasibility and within-patient trends, not to establish a clinical decision threshold.
From demonstration to defensible capability
Larger validation cohort
- Apply the workflow to additional Fontan anatomies
- Include a wider range of narrowing and surgical configurations
- Test whether geometric or flow features predict response
- Develop statistically supported patient-selection criteria
More complete physiology
- Patient-specific exercise measurements
- Closed-loop or multiscale circulation models
- Vessel-wall compliance
- Fluid–structure interaction
- Respiratory effects
- Uncertainty quantification
- Sensitivity analysis of boundary conditions
Clinical translation
- Compare predictions with catheter-based pre/post measurements
- Compare virtual interventions with postoperative imaging
- Evaluate alternative stent diameters and placements
- Quantify uncertainty alongside predicted benefit
- Develop faster preprocedural workflows
- Build clinician-facing intervention comparison tools
Thesis document
Hemodynamic Effects of Virtual Stenting at Rest and During Exercise
Isaias Martinez
- Department:
- Stanford Department of Bioengineering
- Advisor:
- Dr. Alison Marsden
- Year:
- 2026
- Designation:
- Honors Thesis
- Length:
- 56 pages
Tech & topics
- SimVascular
- svMorph
- Computational Fluid Dynamics
- 4D Flow MRI
- Patient-Specific Modeling
- Medical Image Segmentation
- Vascular Geometry Reconstruction
- Tetrahedral Meshing
- Centerlines
- Transient Finite-Element Simulation
- Windkessel Boundary Conditions
- Python
- VTK
- Cardiovascular Biomechanics
- Congenital Heart Disease
- Fontan Circulation
- Virtual Intervention Planning