RESEARCH · 2025–2026
Neonatal Photoacoustic Oximeter
Designed a miniaturized transesophageal photoacoustic sensing system to estimate pulmonary venous oxygen saturation in neonates with congenital heart disease. Across four milestones, our team combined computational modeling, patient-relevant anatomical analysis, benchtop hardware characterization, and hemoglobin-based signal validation.
Staged engineering milestones
Target anatomical sensing-depth envelope
Oxygen-saturation accuracy targetTarget
Peaks analyzed per condition, final benchtop study
The clinical need
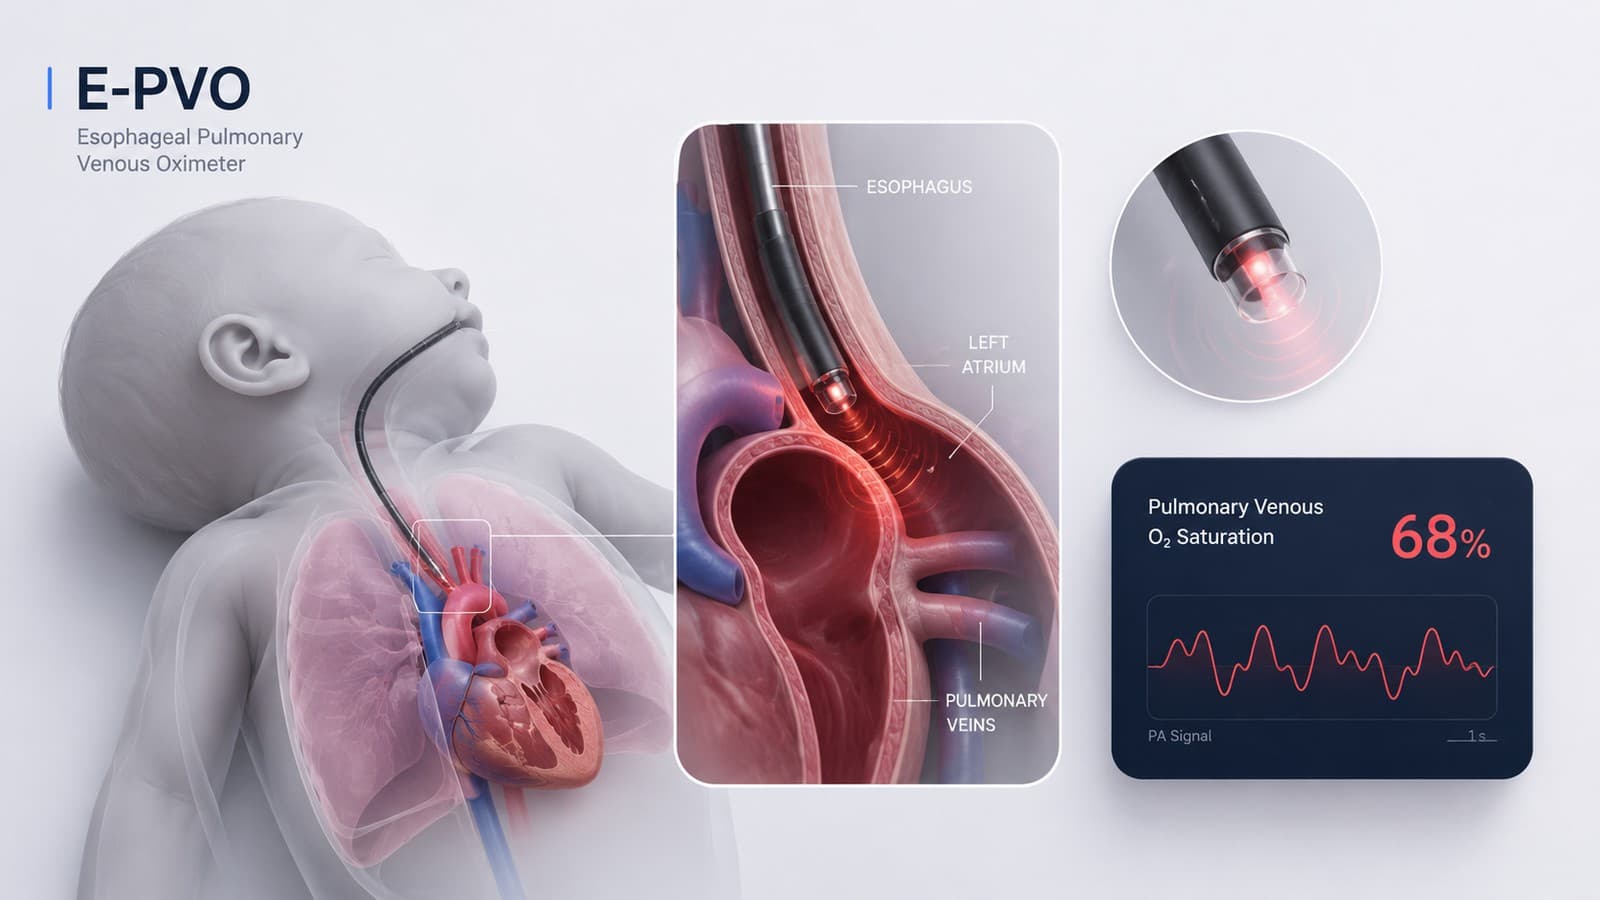
Neonates with congenital heart disease often require invasive measurements to track oxygenation, and the neonatal chest and vasculature leave very little physical space for additional instrumentation. Our team's proposed system aims to obtain pulmonary venous oxygen-saturation information without vascular cannulation, using a route the body already has: the esophagus.
Our design response
The E-PVO is positioned transesophageally, adjacent to the left atrium and pulmonary veins. Multispectral optical pulses are delivered through miniature optical fibers and absorbed by hemoglobin; a co-located ultrasound receiver detects the resulting pressure waves, and bedside signal processing estimates oxygen saturation through spectral unmixing.
Current pathway
Catheter-based or invasive measurement
Proposed pathway
System
How the system works
- 1
Optical excitation
Multispectral pulses travel through miniature optical fibers.
- 2
Hemoglobin absorption
HbO₂ and HbR absorb different amounts of light at different wavelengths.
- 3
Photoacoustic response
Absorbed energy generates transient thermoelastic pressure waves.
- 4
Acoustic detection
A co-located ultrasound transducer records the resulting waveform.
- 5
Signal processing
Filtering, spectral unmixing, and feature extraction recover blood-composition information.
- 6
Saturation estimate
The processed result is translated into an estimated pulmonary venous oxygen saturation.
Development
Four staged milestones
- 1ComputationalFall 2025 / December 2025
“Can raw photoacoustic voltage signals be converted into oxygen-saturation estimates?”
What we did
- Built a simulated photoacoustic forward model
- Used hemoglobin extinction spectra
- Modeled a 5–7.5 MHz receive chain
- Implemented two-wavelength spectral unmixing
- Translated voltage signals into HbO₂, HbR, and estimated saturation
Outcome
- Established an expected signal range and an initial processing architecture
- Produced computational benchmarks for later hardware testing
- Did not constitute experimental validation because hardware was not yet available
Technical details
Modeling assumptions
- Target depth: approximately 8–15 mm
- Pulse-energy study range: approximately 0.25–1.6 μJ per pulse
- Modeled post-pulse signal envelope remained below approximately 0.5 V
Project success targets
- Calibration R² ≥ 0.9
- Mean absolute saturation error ≤ 5%
- Reproducible end-to-end processing
Criteria the team set for itself — not achieved clinical findings.
- 2AnatomicalFebruary 2026
“Can a transesophageal probe safely reach a useful sensing window within neonatal anatomical constraints?”
What we did
- Reviewed neonatal and pediatric anatomical literature
- Segmented the esophagus and pulmonary venous region
- Created three-dimensional models in SimVascular
- Calculated closest-point distances between the esophageal wall and target vasculature
- Evaluated posterior, lateral, and centered probe orientations
Outcome
- Established an approximate 8–15 mm sensing-depth envelope
- Identified probe orientation as an important source of depth and signal variability
- Converted anatomical measurements into probe-diameter, placement, and sensing requirements
Technical details
Anatomical model Posterior-facing Lateral-facing Centered Orientation range Model 1 8.1 mm 10.6 mm 9.4 mm 2.5 mm Model 2 7.8 mm 11.9 mm 10.3 mm 4.1 mm Model 3 9.0 mm 12.7 mm 11.2 mm 3.7 mm Posterior-facing orientations generally reduced the sensing distance in these representative models. This reflects three individual anatomical models, not a completed population-level clinical study.
- 3BenchtopMarch 2026
“Can the laser–transducer acquisition chain be operated repeatably and produce measurable transient signals?”
What we did
- Assembled and troubleshot the optical and acoustic acquisition chain
- Established baseline transducer noise
- Standardized the laser, target, and transducer geometry
- Repeated each test condition across three trials
Outcome
- Established a repeatable baseline
- Identified operating conditions capable of generating measurable transient peaks
- Prepared the system for hemoglobin-containing samples
Technical details
Laser settings
2.5 · 5 · 10
Source-to-target distances
2 cm · 5 cm · 10 cm
Environmental & medium variables
- Lights on vs. lights off
- DI water
- Layered water-front configuration
- Carbon suspensions at 1, 2.5, and 5 mg/mL
Metrics
- Peak-to-peak voltage
- Absolute peak amplitude
- Signal RMS
- Noise RMS
- Peak-based SNR
- RMS-based SNR
- Peak timing
- 4ExperimentalWinter 2026
“Can the acquisition and processing pipeline distinguish signal differences in hemoglobin-containing samples?”
What we did
- Tested hemoglobin concentrations of 25, 75, and 150 mg/mL
- Compared hemoglobin-only samples with fibrinogen-containing samples
- Aligned and averaged three replicate traces
- Subtracted matched background controls
- Localized high-energy regions using RMS analysis
- Applied matched filtering
- Extracted peak-to-peak voltage across 200 detected peaks per condition
Outcome
- The system detected composition-dependent differences in controlled hemoglobin samples
- The fibrinogen experiment demonstrated that biologically relevant matrix effects may confound amplitude-only measurements
Constraints
Designing within neonatal constraints
| Constraint | Engineering implication |
|---|---|
| Approximately 8–15 mm target depth | Optical fluence and acoustic sensitivity must remain adequate across variable anatomy |
| Limited esophageal lumen | The probe must remain miniaturized and flexible |
| Esophageal wall and intervening tissue | Tissue attenuation must be included in the sensing budget |
| Rotational variability | The sensing window should tolerate imperfect probe orientation |
| Wall apposition and acoustic coupling | Mechanical design must maintain safe, consistent contact |
| Neonatal optical safety | Pulse energy and thermal exposure require conservative limits |
| Composition-dependent signal behavior | Calibration cannot rely on amplitude alone |
- Approximately 8–15 mm target depth
- Optical fluence and acoustic sensitivity must remain adequate across variable anatomy
- Limited esophageal lumen
- The probe must remain miniaturized and flexible
- Esophageal wall and intervening tissue
- Tissue attenuation must be included in the sensing budget
- Rotational variability
- The sensing window should tolerate imperfect probe orientation
- Wall apposition and acoustic coupling
- Mechanical design must maintain safe, consistent contact
- Neonatal optical safety
- Pulse energy and thermal exposure require conservative limits
- Composition-dependent signal behavior
- Calibration cannot rely on amplitude alone
Analysis
Signal-processing pipeline
The final experimental processing sequence, from raw oscilloscope traces to statistical comparison. Tap a stage for a one-line explanation.
Results
What the experiments showed
- Hemoglobin only
- Fibrinogen + hemoglobin
- Error bars show ± 1 SD
| Concentration | Hemoglobin only (mean Vpp) | Fibrinogen + hemoglobin (mean Vpp) |
|---|---|---|
| 25 mg/mL | 4.605 ± 0.555 mV | 3.402 ± 0.557 mV |
| 75 mg/mL | 4.345 ± 0.592 mV | 3.427 ± 0.446 mV |
| 150 mg/mL | 5.782 ± 0.824 mV | 3.435 ± 0.468 mV |
Hemoglobin only: one-way ANOVA F = 261.5, p < 0.0001. Fibrinogen + hemoglobin: one-way ANOVA F = 0.24, p = 0.784.
- Hemoglobin-only samples exhibited statistically distinguishable signal amplitudes.
- The largest response occurred at 150 mg/mL.
- Fibrinogen-containing samples showed nearly overlapping responses, motivating more robust calibration and compensation methods.
My role
My contributions
This was a five-person team effort. The contributions below describe what I personally worked on within that team, not sole ownership of the project.
- Clinical framing
Contributed to translating the clinical need into sensing, localization, and validation requirements.
- Staged strategy
Helped develop the project's staged de-risking strategy across simulation, anatomy, and benchtop testing.
- Anatomical analysis
Contributed to anatomical modeling and interpretation of esophagus-to-pulmonary-vein sensing constraints.
- Experimentation
Supported experimental design, waveform analysis, and interpretation of photoacoustic results.
- Technical communication
Helped communicate technical findings through milestone reviews, reports, and design iterations.
Engineering judgment
Technical challenges and decisions
Challenge 1
Hardware was unavailable during the initial milestone
Decision
Build the signal-processing and expected-voltage framework in simulation first.
Why it mattered
This established expected signal ranges and informed later analog-front-end and acquisition decisions.
Challenge 2
Sensing performance depends on anatomy and orientation
Decision
Use three-dimensional segmentation and closest-point distance analysis to define the feasible operating envelope.
Why it mattered
This connected the abstract sensing concept to realistic probe dimensions and placement constraints.
Challenge 3
Amplitude can reflect multiple biological and experimental factors
Decision
Compare hemoglobin-only samples with fibrinogen-containing samples using the same processing pipeline.
Why it mattered
The flattened fibrinogen results showed that future saturation estimation will require calibration beyond simple amplitude comparisons.
Reflection
What we learned and what comes next
What we demonstrated
- A computational pipeline for simulated photoacoustic oximetry
- A realistic anatomical sensing-depth envelope
- A repeatable laser–transducer benchtop setup
- Detectable signal differences in hemoglobin-containing samples
- A reusable waveform-processing and statistical-analysis pipeline
What remains
- Use wavelength-dependent excitation to isolate oxygenation effects
- Validate saturation estimates against known oxygenation states
- Demonstrate the ±5% accuracy target experimentally
- Improve compensation for depth, fluence, tissue, and sample composition
- Integrate the optical, acoustic, mechanical, and processing subsystems
- Validate neonatal-safe optical and thermal operating limits
- Test in a more anatomically realistic esophageal–vascular phantom
Taken together, this project was a successful de-risking effort: it established technical feasibility questions across simulation, anatomy, and hardware, and defined the specific validation work still required before oxygen saturation itself can be measured experimentally.
Tech & topics
- Medical Devices
- Biosensors
- Photoacoustics
- Hardware
- Signal Processing
- Neonatal Care